About the Project
Why Methane?
- 01Immediate ImpactMethane's global warming potential is over 80 times greater than CO2 in a 20-year timeframe. Addressing this short-lived climate pollutant is key to limiting temperature rise to 1.5 °C.
- 02Waste Sector SignificanceThe waste sector accounts for about 20% of methane emissions and is the third largest source after agriculture and oil and gas. Curbing emissions from waste is vital to global methane reduction efforts.
- 03Co-benefits for communitiesMitigating methane from the waste sector reduces both VOCs and ground-level ozone, fostering a healthier environment and directly enhancing community wellbeing.
- 04Economic BenefitsThere are local economic benefits through job creation from improved waste collection, treatment, and disposal.
Our Story
What is the gap?
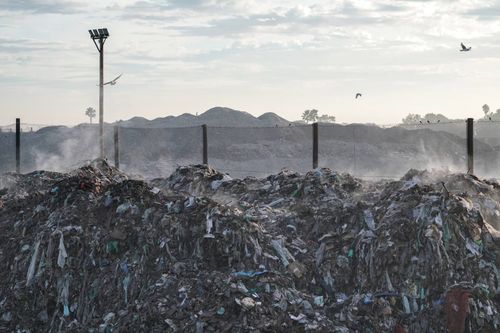
In recent years, airborne surveys of landfills and dumpsites have found large methane plumes emanating from waste disposal sites. Thanks to these surveys, the waste sector is increasingly receiving the attention needed to spotlight its contribution to methane emissions.
After agriculture, and oil and gas, the waste sector is the third largest contributor to methane emissions. But emissions data for the waste sector are limited and often inaccessible, and where data exists the level of granularity is insufficient to inform targeted emissions reduction measures.
How is our team filling this gap?
To address this gap, we developed the Waste Methane Assessment Platform (WasteMAP), an open online platform that aggregates existing sectoral data globally, including national inventory data, city-level data, and facility-level data.
Where data does not exist, we have leveraged the Solid Waste Emissions Estimation Tool (SWEET), a decision support tool (DST) developed by the US EPA, to estimate methane emissions at the city level. The DST allows a user to calculate their baseline emissions and evaluate the impact of alternative waste management practices (e.g., organics diversion, improving gas collection at specfici facilities). We are also working with several cities to collect facility level data and fine-tune model inputs to improve the accuracy of emissions estimates. To enable our own work and make it more accessible to a wider audience, we have adapted the SWEET model in python. This work is open-source and available on GitHub.
To complement the platform, we are working on the ground in select countries including Colombia, Ecuador, Mexico, Nigeria, India, the Philippines and the United States. This country engagement work includes collaborating with national and subnational governments, supporting policy makers in setting waste methane reduction targets, providing technical assistance, building local capacity, and facilitating peer-to-peer knowledge exchange. Country engagement enables more robust data that can be incorporated into the platform to improve emissions estimates.
What is the expected outcome and impact?
By aggregating sectoral methane emissions on a single platform, we can identify top methane sources by geography or facility. The insights generated will inform actionable emission reduction at the site level and enable deployment of resources to the highest priority intervention areas. For facilities that implement methane abatement improvements, the platform aims to track changes in methane emissions over time. Lessons learned can be shared with other facilities operators and key decision makers to scale methane reduction.
Who is involved?
WasteMAP is a collaboration between RMI and Clean Air Task Force (CATF) with generous support from The Global Methane Hub and Google.org. Data aggregation, analysis, and modeling is done by RMI's data science team. Content is provided by RMI and CATF. The mapping and web application is done in partnership with Earth Genome, a non-profit technology provider specializing in earth observation and conservation.
Trusted partners
 RMIRMI is an independent nonprofit, founded in 1982 as Rocky Mountain Institute, that transforms global energy systems through market-driven solutions to align with a 1.5°C future and secure a clean, prosperous, zero-carbon future for all.
 CLEAN AIR TASK FORCEClean Air Task Force is a non-traditional, fact-based, environmental organization dedicated to pushing the technology and policy changes needed to achieve a zero-emissions, high-energy planet at an affordable cost.
With grant support from
 GLOBAL METHANE HUBThe Global Methane Hub collaborates with governmental and non-governmental entities to scale up cost-effective solutions in methane mitigation in the energy, agricultural, and waste management sectors..
 GOOGLE.ORGGoogle.org combines funding, innovation, and technical expertise to support underserved communities and provide opportunity for everyone.