Data & Methodology
About the Waste Methane Assessment Platform (WasteMAP)
Methane is a potent greenhouse gas (GHG) that has been responsible for 30% of global warming since pre-industrial times and causes more than 80 times the warming impact of carbon dioxide over a 20-year time frame. The waste sector is the third largest methane emitter behind agriculture and oil and gas, accounting for 20% of the total, of which solid waste is responsible for 12%. Reducing methane emissions from the waste sector is critical to slow near-term warming, improve local air quality, and protect public health.
 Figure 1: Global anthropogenic methane emissions by source, 2024, IEA Global Methane Tracker 2024, UNEP, CCAC 2022
Currently, there is a lack of consistent waste and related methane emissions data, particularly at the city and facility levels, and data availability varies significantly across countries and regions. At the national level, countries report their GHG emissions in line with their obligations under the United Nations Framework Convention on Climate Change (UNFCCC). At the sub-national level, various initiatives led by the United Nations, the World Bank, C40 Cities, and international development agencies have been prompting data collection and information sharing.
WasteMAP brings together reported and modeled data sources to paint a picture of the current methane emissions situation from MSW globally, aiming to highlight data and resource gaps that exist. The information below focuses on the backend infrastructure of WasteMAP. For information on how to use the user interface, please see How to Use WasteMAP.
Map Layers
WasteMAP presents waste data and emissions data from MSW generation, treatment, and disposal in three different map layers: a country-level choropleth layer that shows national inventories normalized by population, and two point-of-interest (POI) layers that show cities and facility-level waste characteristics and emissions. Satellite and flyover observed methane plumes data are also attached to the facility POI layer where available.
Country-level layer
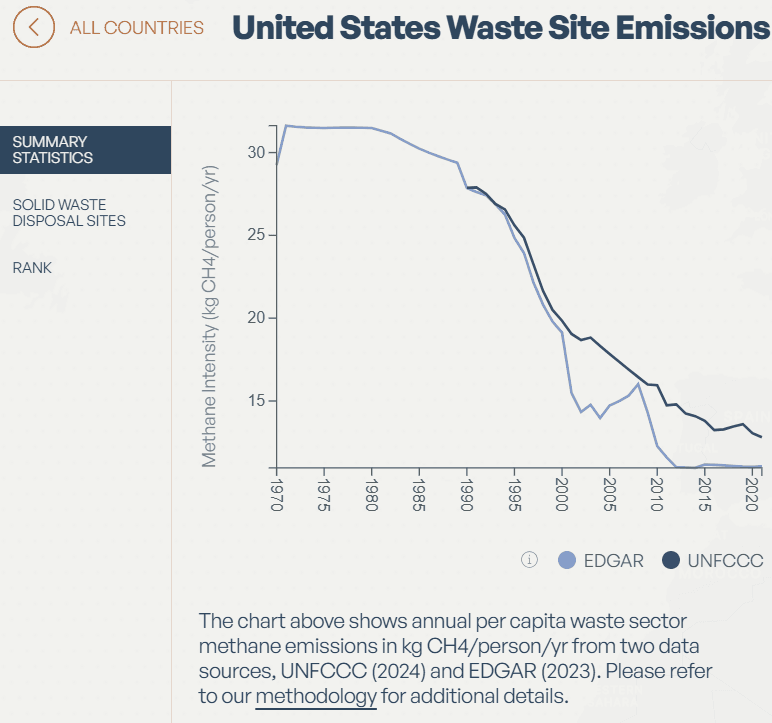
WasteMAP shows country-level emissions from two different sources. One is Emission Database for Global Atmospheric Research (EDGAR) and the other is the UNFCCC, which includes reporting from Annex I countries and non-Annex I countries.
EDGAR provides modeled, globally harmonized, sector-specific estimates of anthropogenic GHG emissions, including methane. It is maintained by the Joint Research Centre of the European Commission. To estimate methane emissions from MSW, EDGAR applies a first-order decay (FOD) model consistent with the 2006 IPCC Guidelines. Key parameters include per capita waste generation rates, waste composition, decay rates, and the degradable organic carbon content of each waste type. The model also incorporates waste destination data for diversion and disposal and considers the characteristics and technologies of waste disposal sites, including landfill design and operational parameters. While EDGAR primarily relies on IPCC regional and country defaults, it integrates nationally reported data from UNFCCC inventories where available.
The UNFCCC is an international treaty to reduce “human interference with the climate system.” Its secretariat maintains a database of GHG emissions submitted by Parties, including methane emissions from the waste sector. These national GHG inventories vary in detail and methodology depending on the reporting country's data availability and technical capacity. Annex I countries and non-Annex I countries also have different reporting obligations. Non-Annex I countries are required to submit information less frequently and often have more flexibility in the requirements.
To estimate waste sector methane emissions, most countries use the FOD model described in the 2006 IPCC Guidelines. Countries may apply default parameter values from the IPCC—either global, regional, or country-specific—as used by databases like EDGAR. However, countries are encouraged to collect and use detailed information about their respective waste management systems.
WasteMAP presents two country-level emission values on a time series chart:
- Total emissions, reported in kilotons (kt CH₄) per year
- Per capita emissions, expressed in kilograms (kg CH₄) per person per day
City-level layer
City-level emissions are estimated with the Solid Waste Emissions Estimation Tool (SWEET) developed by the US Environmental Protection Agency (EPA). SWEET uses information on waste mass and characteristics, waste diversion practices, facility design, and environmental factors to estimate GHG emissions and other climate pollutants such as black carbon. The WasteMAP team developed a Python version of the tool by adapting the underlying model that estimates methane emissions from waste diversion and disposal. We also incorporated an estimate of the impact on food loss and waste prevention.
The model begins with per capita waste generation to determine total waste generation in a given city. The destination of generated waste is then determined: waste is either diverted or disposed of. For diversion, the following options are considered: recycling facilities, anaerobic digesters and composting facilities. For disposal, the waste is either incinerated for energy recovery (commonly known as waste-to-energy) or disposed of in landfills or dumpsites. Methane emissions from disposed waste are calculated using an FOD model similar to the one typically deployed in the UNFCCC reporting mentioned above. Input values and parameters are determined with city-specific information where available; where data are not currently available, regional default values from SWEET, the 2006 IPCC report, and the 2019 update to that report are used. The output from the Python SWEET model is methane emissions expressed in tons per year, which is then normalized by the city’s population to generate per capita emissions estimates.
Input Data for City-Level Python SWEET Model
A city-level waste dataset was generated by integrating available waste data and processing it using the python SWEET model. The compiled waste dataset includes information from the World Bank What a Waste (2018) and UN Habitat Waste Wise Cities Tool, with waste generation, waste characterization, and waste destination (treatment and disposal) data. Most waste data for Brazil cities comes from the National Information System on Solid Waste Management (Sistema Nacional de Informações sobre a Gestão dos Resíduos Sólidos, SINIR). As we continue to expand the user base and collaboration of WasteMAP, more data are being added to the database, including contributions from the Circulate Initiative, Clean Air Task Force, and the Lagos Waste Management Authority through RMI's country engagement efforts. Raw data was processed to extract relevant information for the Python SWEET model.
When source data for total waste generation and city population are from different years, the population is adjusted to match the waste generation data year using a population growth rate. This enables a consistent and accurate calculation of per capita waste generation. The growth rate is calculated using the same method applied throughout the tool, as described below. In Python SWEET modeling, the per capita waste generation rate is assumed to remain constant over time, and therefore, total waste generation grows at the same rate as population growth of a given city.
In addition to waste generation, waste characterization, and waste destination, the Python SWEET model also needs precipitation and population growth rate data as model inputs. Population growth rates are derived from historical and projected population data from the United Nations Department of Economic and Social Affairs (UNDESA) World Urbanization Prospects: 2018 Revision. Population data was matched by city name while cities without a match were tied to the next nearest population center from the UNDESA dataset. Precipitation was retrieved from WorldClim at 10-minute intervals, which is a spatial resolution of 340 km2. The data is compiled using 264 rasters (TIF files). Each raster represents the total precipitation of one month in a year between 2000 and 2021. Precipitation is grouped and summed by year and then averaged as input into the Python SWEET model. Latitude and longitude coordinates for all cities in WasteMAP were generated using the Nominatim package from OpenStreetMap © OpenStreetMap contributors.
Site-level layer
WasteMAP uses the Climate TRACE waste sector facility level emissions dataset for the site-level layer. The RMI WasteMAP team has been the sub-sector lead for solid waste disposal in the Climate TRACE Coalition since 2025. Depending on whether a site has associated reported emissions data, methane emissions of the given site are estimated and projected through either a FOD or a non-FOD pathway based on statistical methods. After this process, if a site has satellite observations in at least five months in the past, this data is used to inform and update the emissions estimate of the site through either incoming waste calibration or scale factor fusion. For a more detailed description of our modeling approach, please refer to section 2.2 in this methodology document.
The annual methane emissions from a specific site are then normalized by annual accepted waste (tons/year) to obtain emissions intensity in the unit of kg CH4 per ton of waste accepted to make emissions comparable across sites.
In addition to emissions estimates, the site-level cards also include time series satellite and flyover observed methane emissions rates and the latest methane plume image for the site, some of which are used to update site emissions estimates, as mentioned above. The satellite data are obtained from Carbon Mapper's open data portal and SRON Netherlands Institute for Space Research through the Targeting Waste emissions Observed from Space (TWOS) project. New satellite data will be added to the WateMAP webtool as they become available.
Users of the WasteMAP site are also advised that the satellite data provided by SRON will be published in a scientific paper by SRON et al. If you would like to use parts of these data in a scientific paper please contact SRON at TWOS@sron.nl. GHGSat data will remain property of GHGSat, commercial use not permitted. Airborne survey and satellite methane plume data for a select set of landfill sites are obtained from Carbon Mapper Data Portal. The use of Carbon Mapper data for non-commercial purpose is subject to Modified Creative Commons Attribution Share Alike 4.0. Please contact Carbon Mapper if you plan to use their data for any purposes that are not in line with their terms of use. Additional satellite and airborne data from Carbon Mapper will be added to the Waste MAP site when they become available.
Decision Support Tools
A unique feature of WasteMAP is its city and site-level decision support tools (DSTs), which enable users to estimate baseline methane emissions from a city’s current waste management practice or a facility’s operational parameters, respectively. The users are also able to model the methane mitigation potential of improved policy and practices. These tools enhance emissions transparency by helping users understand the material impact of improved waste diversion and disposal on methane mitigation. This insight supports the development of actionable policies and operational decisions that drive real emissions reductions.
Underlying the DSTs is the Python SWEET model mentioned above. API endpoints connect the model to the WasteMAP frontend, allowing users to estimate baseline methane emissions and explore methane mitigation scenarios with various waste management practices.
City Decision Support Tool
For cities where baseline emissions have been modeled and published in the city-level map layer, information in our database will be auto-populated into the DST. Additional information needed to model alternative scenarios include the scenario start year, waste diversion and disposal rates, and disposal facility design features, such as gas collection and control systems.
Behind the scenes, the Python script uses this information to calculate methane emissions from the alternative scenarios and present a comparison between baseline and alternatives.
For cities that do not currently have a modeled time series on the city-level layer of WasteMAP, users need to provide additional information to estimate the baseline, including population and precipitation using the “custom location” option. Users are welcome to contribute their city-level waste data by sending the data to WasteMAP@rmi.org. The data will be validated and published on WasteMAP.
For a comparison between the functionalities and assumptions between the original version of SWEET and the Python version, please see the documentation here.
To access the original version of SWEET to conduct more detailed modeling of scenarios, please visit here.
Site Decision Support Tool
Similar to the City DST, the Site DST is based on US EPA’s SWEET and pulls in information about specific sites (e.g., site type, site status, site opening/closure year, waste composition, and incoming waste amount) about specific sites from Climate TRACE and other data sources curated by the WasteMAP team. For sites where we do not have metadata, regional or country-level defaults from SWEET, the 2006 IPCC report, and the 2019 update to that report are used. When users click “Apply Defaults for this Location” on the Site DST, the curated data in our database will be populated for the users. They can also override the defaults with their own data for baseline emissions estimates.
To model scenarios with adjusted parameters, users need to provide additional information, including scenario start year and alternative site management practices such as an improved biocover oxidation rate or capture efficiency of gas collection systems.
Note on Data and Modeling Accuracy
Due to data gaps and significant variation in data availability across countries, the current version of the platform often relies on IPCC regional and country-level default values — such as per-capita waste generation, waste composition, and gas collection efficiency — for estimating city- and site-level methane emissions. As a result, the accuracy of these estimates may be limited in certain local contexts. The data and modeling results presented reflect the best available estimates and will be refined as more local data becomes available.
Data and Code
UNFCCC
EDGAR
World Bank What A Waste
UN Habitat Waste Wise Cities
Climate TRACE
Carbon Mapper Data Portal
SRON
Inter-American Development Bank Solid Waste and Circular Economy Hub
The Circulate Initiative
In addition to collecting public data, the WasteMAP team also models methane emissions through the Solid Waste Emissions Estimations Tool (SWEET). SWEET is originally an Excel model created by the US EPA for calculating greenhouse gas emissions associated with solid waste mnaagement. The WasteMAP team ported key components of the Excel version to Python to power the Decision Support Tools. You can find the repo for the SWEET Python model below. We welcome community contributions!