How to use WasteMAP
Below is a guide for using WasteMAP, starting with the map features, followed by the Decision Support Tools (DSTs). If you are interested in information on the data and methodology behind WasteMAP, please visit our Data and Methodology page.
The Map
Clicking View Map from the home page will take you to the main map interface, where you can view waste methane emissions data at the country, city, and site levels.
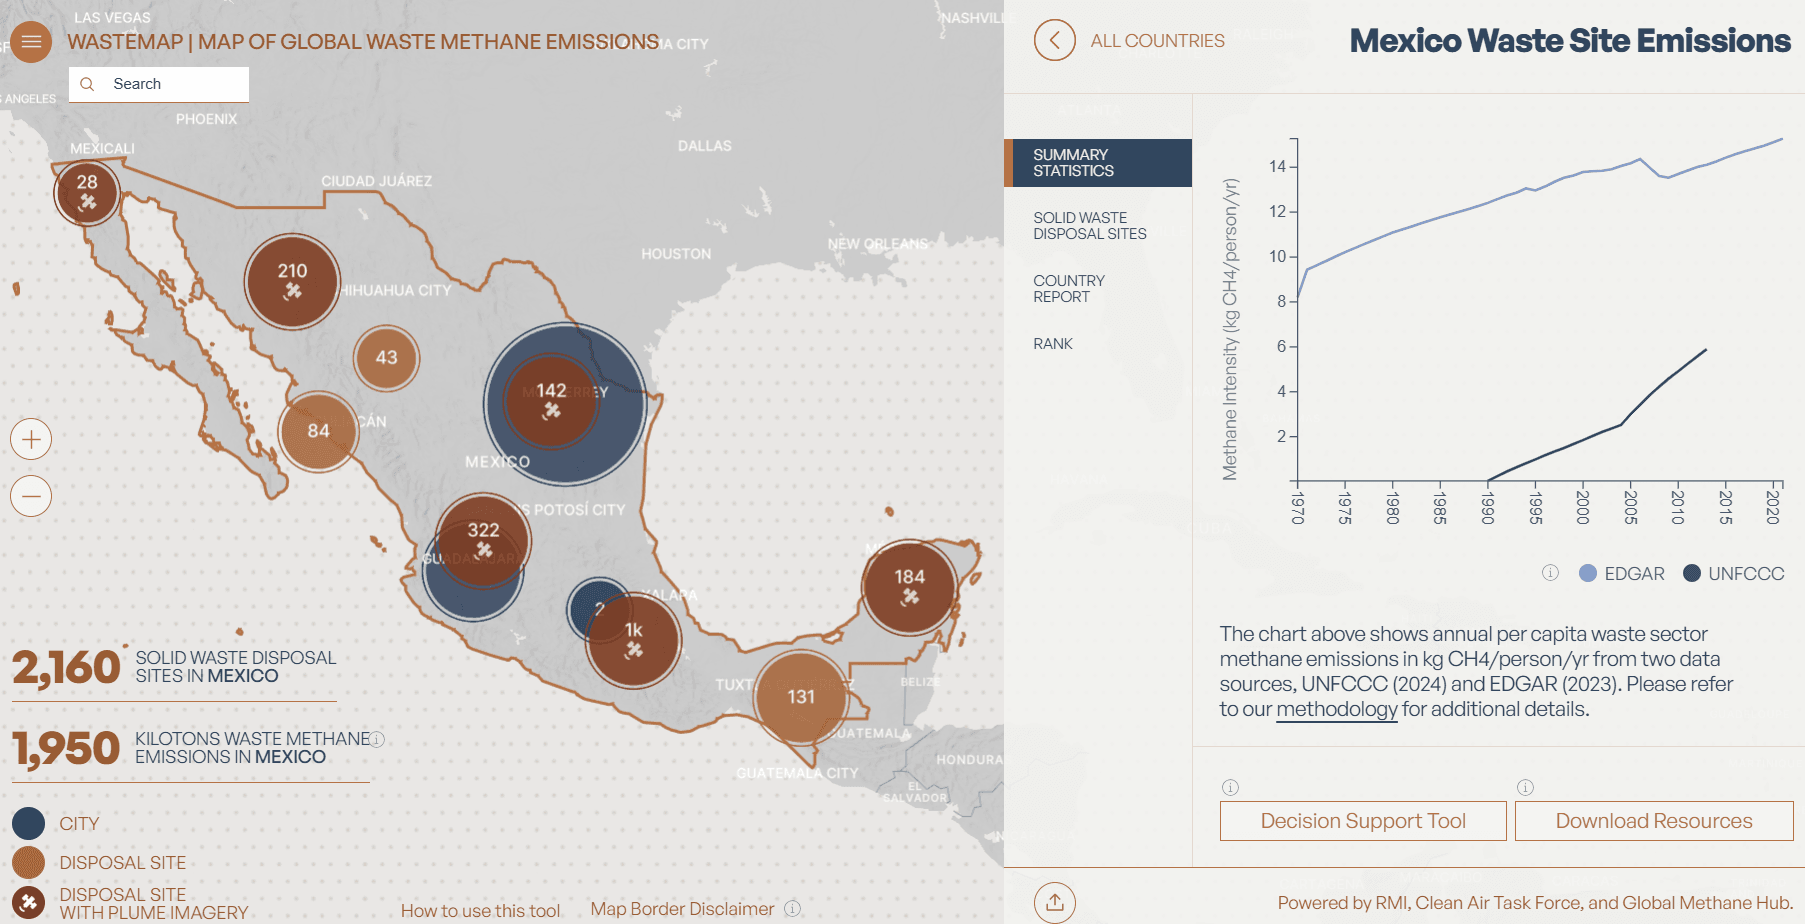
Country level
Select a country on the map. The map will zoom in and open an information pane on the right showing summary statistics for the country, as well as tabs for viewing solid waste disposal sites (i.e., landfills and dumpsites), global emissions ranking, and country report for selected countries in Latin America and the Caribbean (LAC).
The summary statistics tab contains two separate time series of per capita methane emissions from EDGAR and UNFCCC. The solid waste disposal sites tab contains a list of known disposal sites in the country you are viewing, and the corresponding methane emissions of each site in tons per year. You can click on a site and go to the site-level view, which is explained below. The rank tab contains two different rankings, one by per capita methane emissions per year and the other by total emissions per year. For some countries in LAC, the country report containing information about waste generation, collection, treatment, and disposal is available based on information from the Inter-American Development Bank.
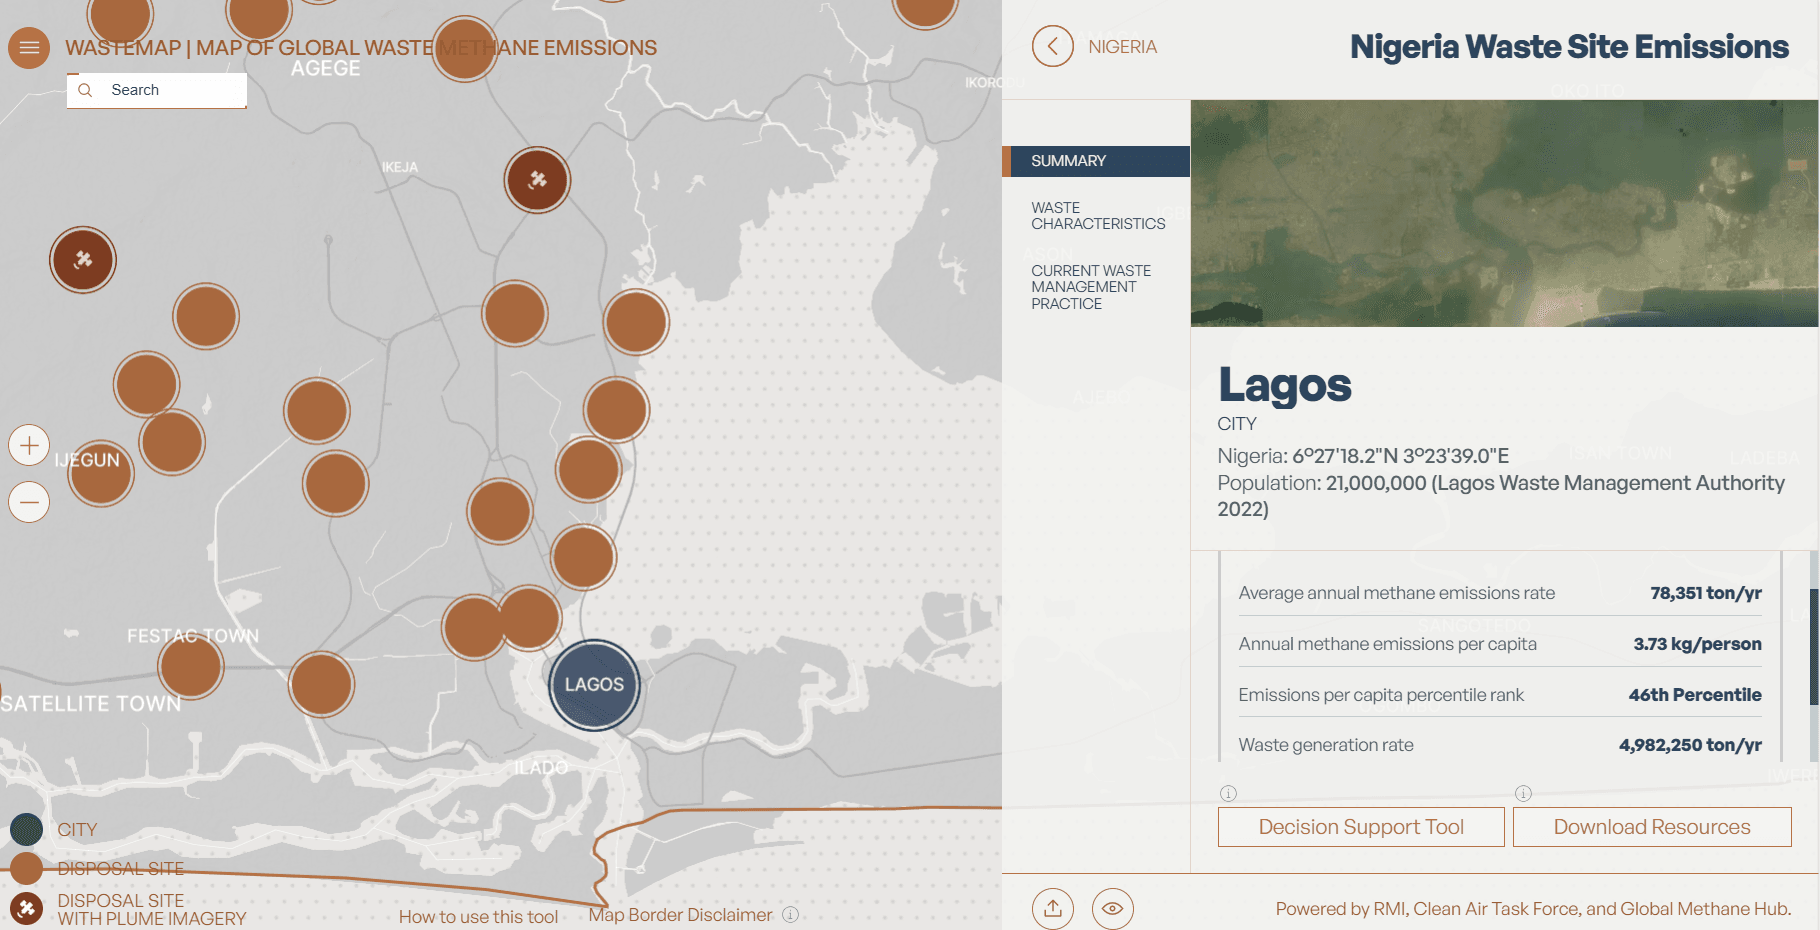
City level
Select a city within the country for which data is provided and an info pane with summary, solid waste disposal sites, waste characteristics, and current waste management practice appears on the right. You can also navigate to the DST to model methane emissions comparing current vs. alternative waste management practices. If you navigate to the DST from the map rather than the global site navigation, the tool will be pre-populated with data available for the map level you were viewing.
Site level
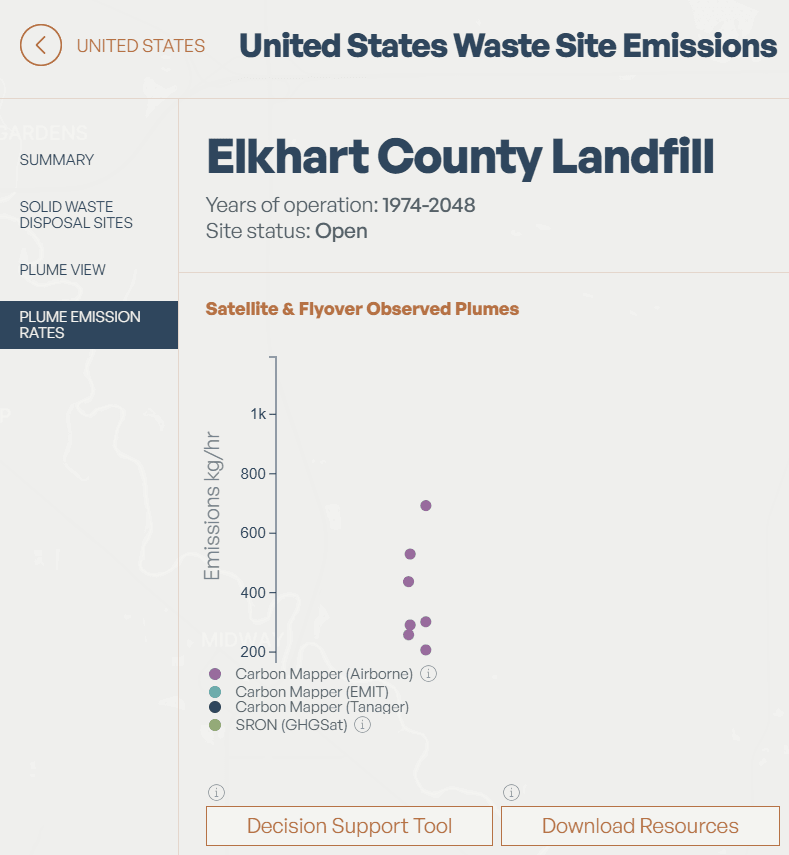
Select a site to view a pop-up with a summary, solid waste disposal sites, plume view, and plume emission rates. Plume view and plume emission rates may not always be available. All sites where we have plume data are marked with a satellite symbol on the corresponding dot on the map and differentiated with a darker shade of brown. When the map view is less zoomed in, each brown dot represents a cluster of disposal sites, and the number included on the dot indicates the number of sites in a given cluster. You can click on the cluster to zoom in further.
Similar to the city-level map layer, you can also navigate to the Site DST directly from each site's info card. This will automatically populate the DST with the site's information.
Search Function
The search bar is located in the top left corner of the map view. To navigate directly to a location, type the name of a country, city, or site, then select the desired result from the dropdown list.
City Decision Support Tool
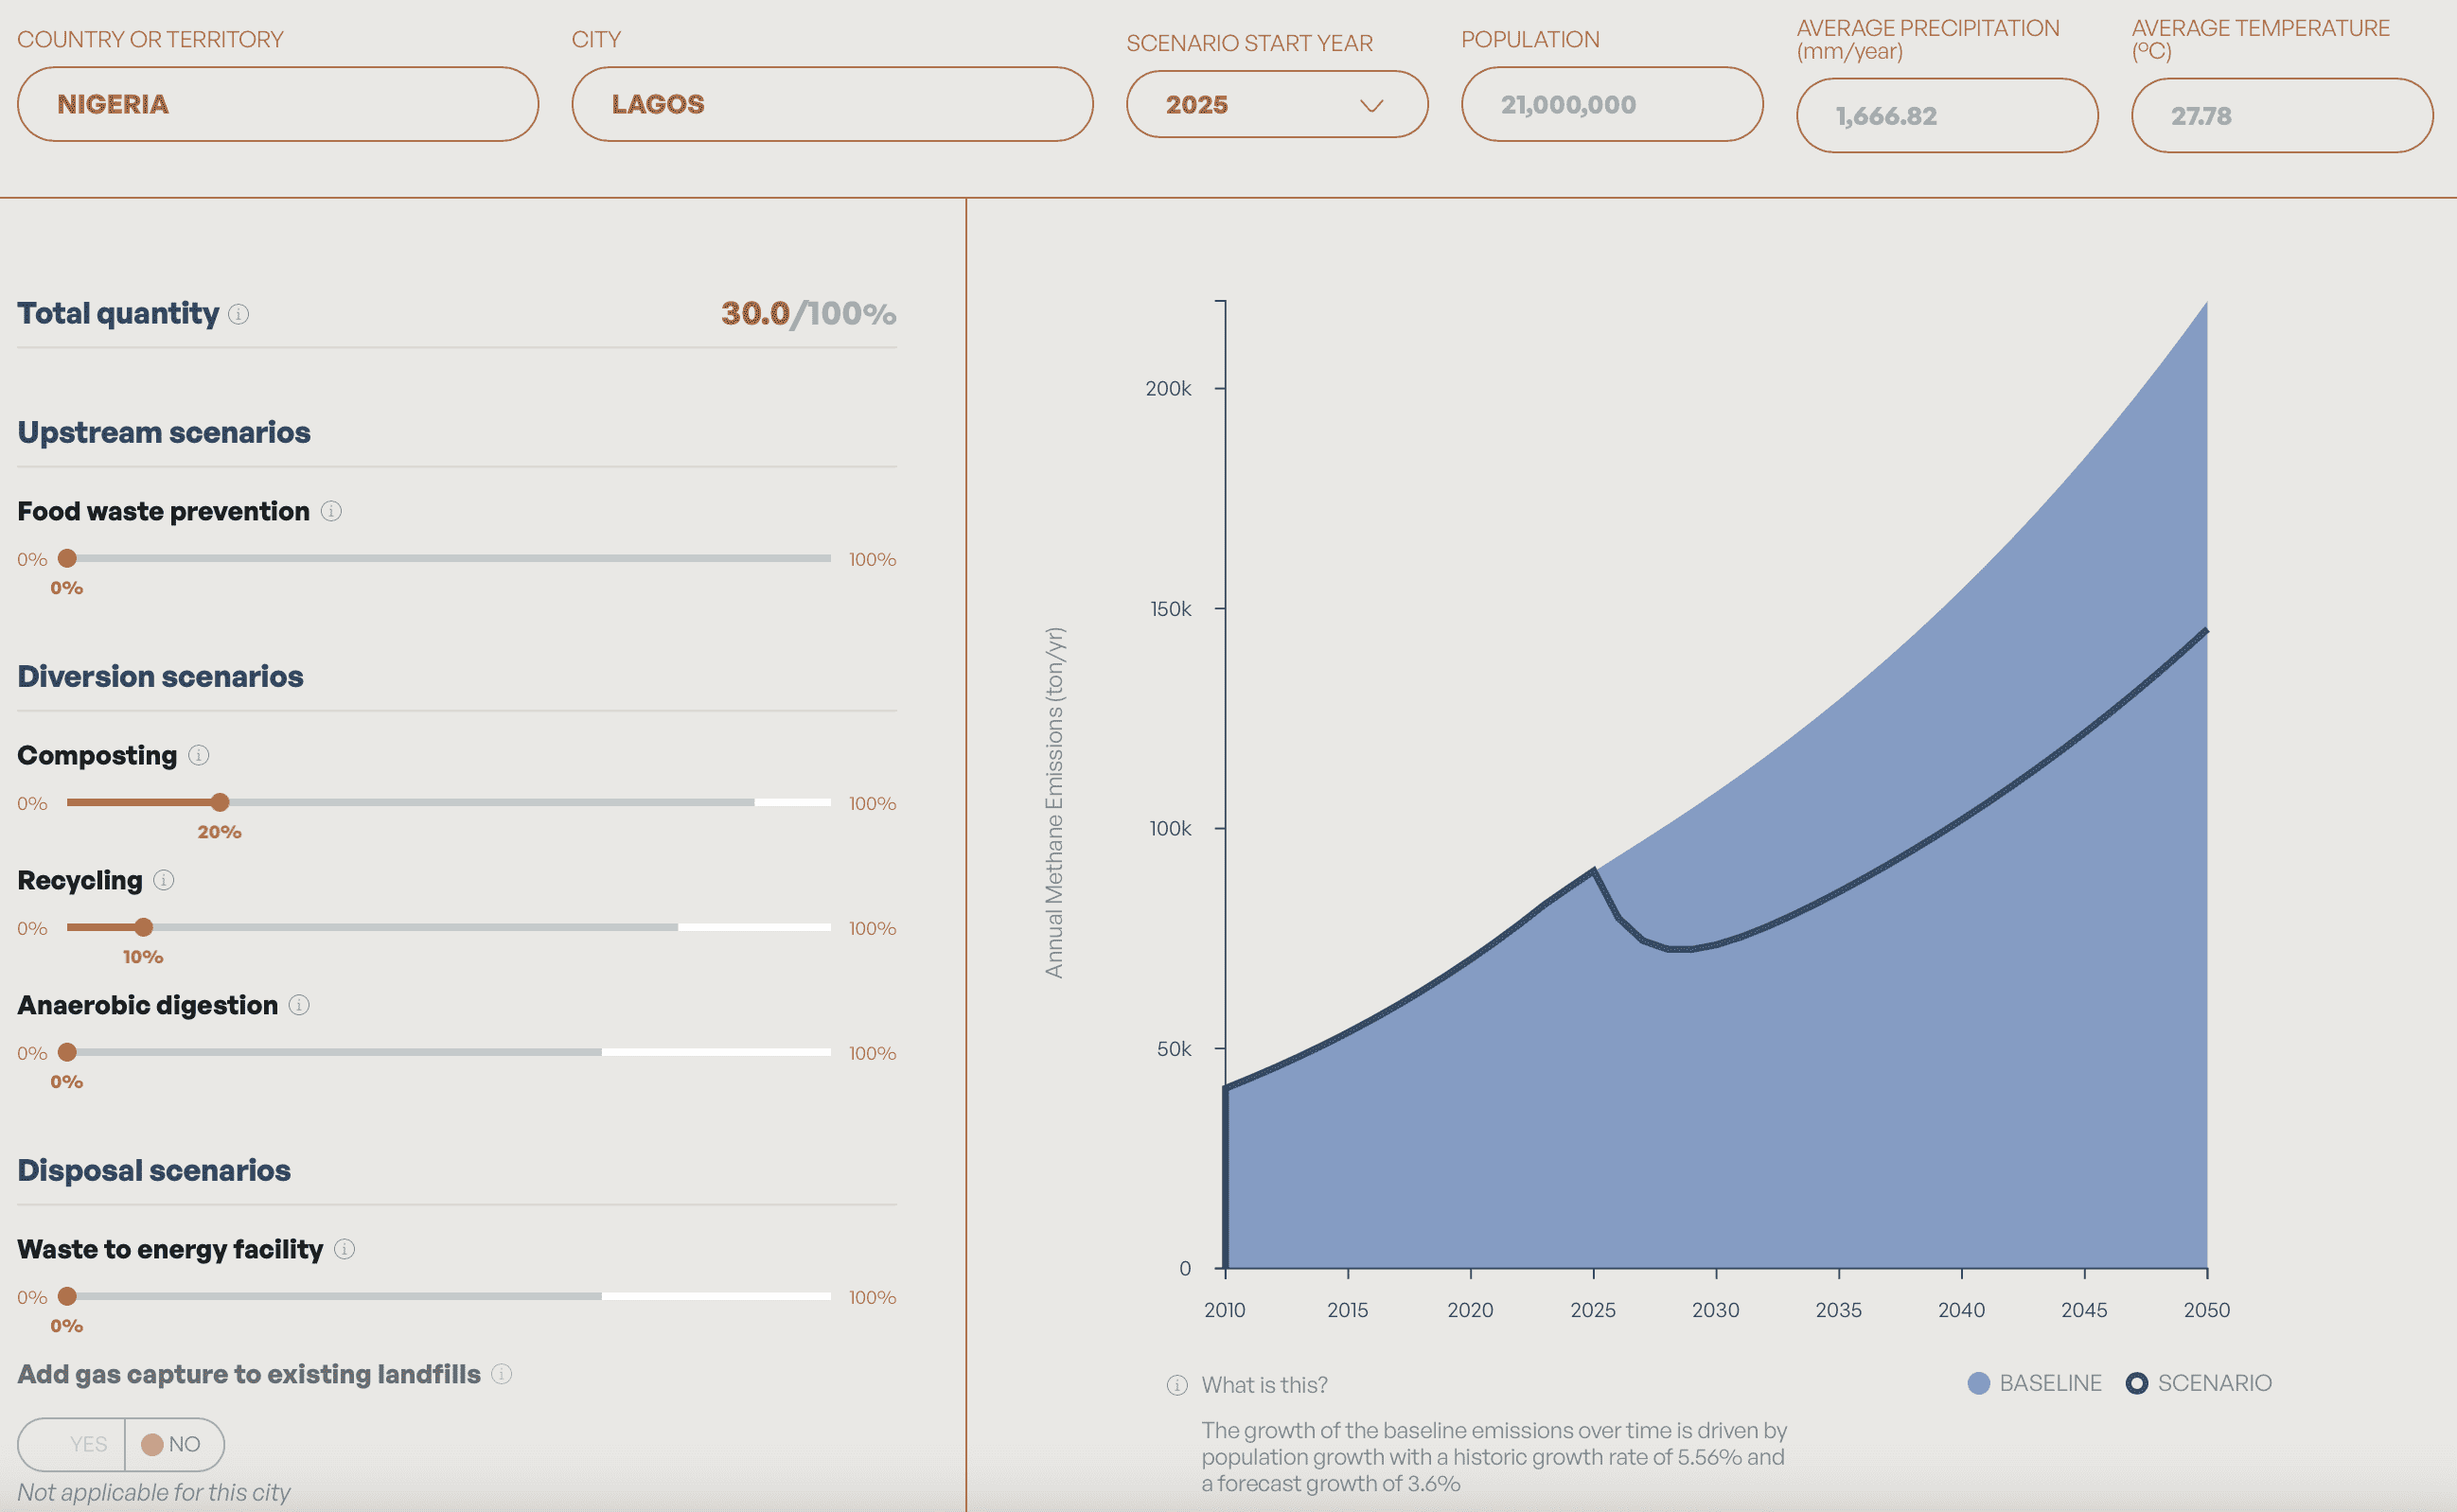
Navigate to the City DST from the city layer or directly from the menu navigation. Both pathways allow you to select an existing city or model methane emissions for a city for which we do not currently have data. The tool helps you model emissions based on waste generation, treatment, and disposal practices. It also takes into account disposal facility type and the incorporation of gas capture and control systems.
To begin, select a country and city from the dropdown list. For cities in our database, population, precipitation, and current waste management practices related data will be auto-populated. To estimate emissions from a city that we do not currently have data for in our database, please use the “custom city” function and enter population and precipitation numbers. Country or regional defaults in our database will be auto-populated for the rest of the fields.
To estimate the methane reduction potential of improved waste diversion, move the slider for composting, anaerobic digestion, and recycling, as needed.
To estimate the methane reduction potential of adding gas capture and control systems to disposal facilities, flip the “add gas capture to existing landfills and dumpsites” button to “Yes”.
To estimate methane reduction potential of upgrading a dumpsite to a sanitary landfill with gas capture and control systems, flip the “create a new landfill with gas capture” and move the slider below to select the percentage of waste in the city that goes to the new facility.
Here are the general rules you can follow for modelling city level methane emissions.
- The total percentage of waste that is sent to composting, recycling anaerobic digestion, and waste-to-energy cannot exceed 100%.
- The sum of % composted, recycled, and anaerobically digested cannot exceed the amount of total organic waste. For example, you may find that the maximum you can compost for a particular city is 48% when all other diversion scenarios are set to 0. However, that maximum allowable composted % drops when recycling or anaerobic digestion percentages increase. These maximum percentages are location dependent.
- The sum of % recycled and % sent to waste-to-energy facilities cannot exceed the amount of total inorganic waste.
- Modeling outside of the allowed parameters will return an error (“Something went wrong. Please select another country/city”). This does not mean the tool is broken. Rather, you have exceeded one of the modeling thresholds not displayed on screen. Lowering the percentage of waste diverted to one or more types of facilities will fix this error.
Site Decision Support Tool
Navigate to the Site DST from the site layer or directly from the menu navigation. This tool helps you model baseline emissions from a given site and explore methane mitigation potential for improving site design and operations, such as improving gas collection efficiency or applying biocover.
Please note that baseline emissions time series may differ from the values displayed in the site-level map layer for locations with satellite observations available from the past five months. The emissions estimates in the DST are generated using the SWEET Python model (FOD pathway) and are not informed by satellite data or reported emissions, whereas the emissions estimates shown on the site-level map layer have been updated through the incorporation of recent satellite observations or reported emissions.
For a site that is not currently in our database, you can input your own data or click on the “apply defaults for this location” button to auto-populate corresponding regional or country-level defaults in the database. All information populated from the database can be over-written if you have your own specific data.
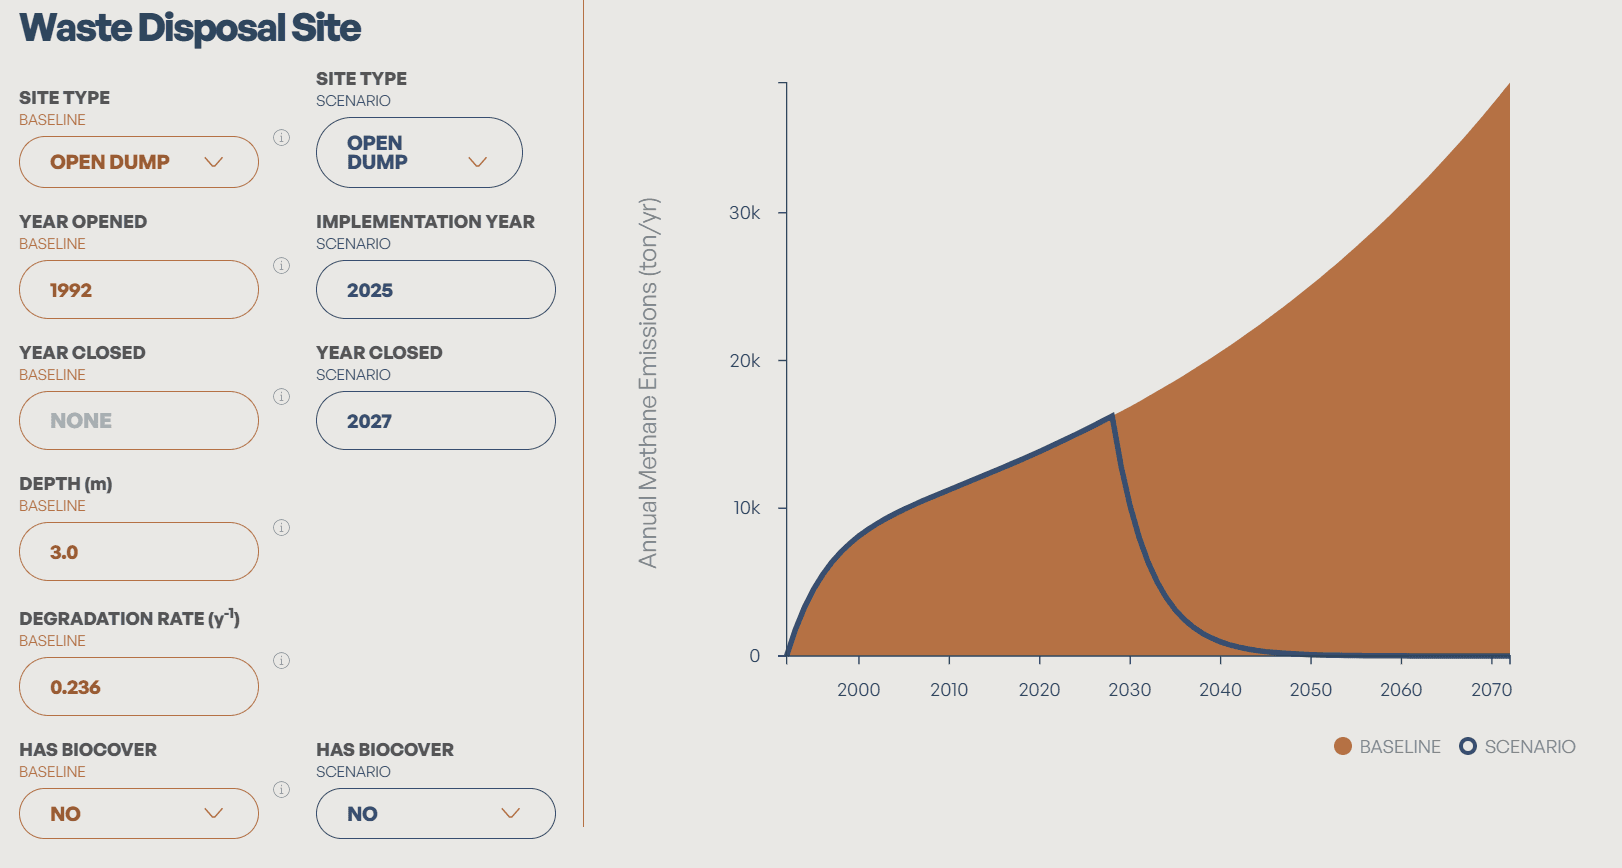
The left column (orange cells) captures baseline inputs such as site type and waste composition. The right column (blue cells) allows users to simulate mitigation scenarios—for example, estimating emissions reductions from closing an open dumpsite, converting it to a controlled site, or increasing gas capture efficiency at a sanitary landfill.
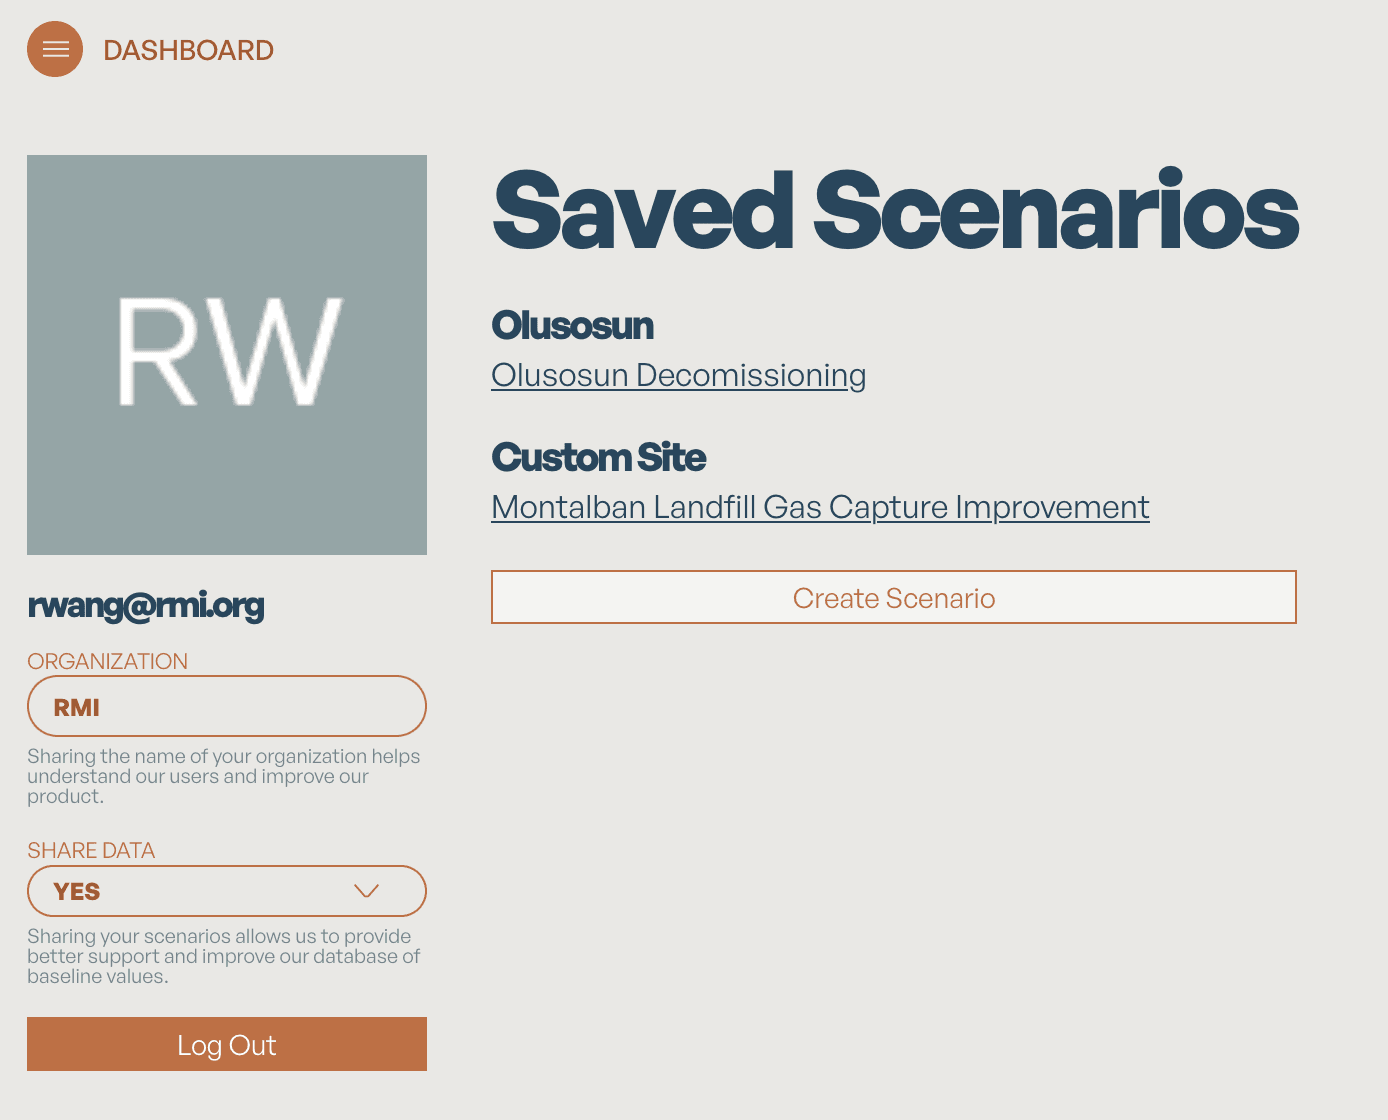
Creating an Account to Save Scenarios
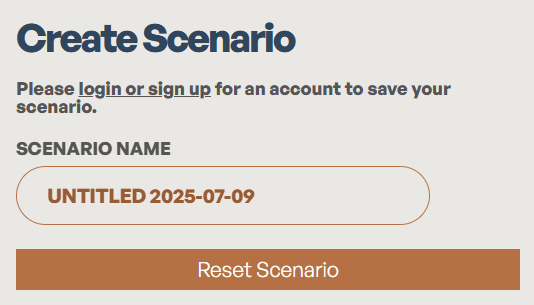
If you would like to save baseline and alternative scenarios run in the Site DST, please create an account using your e-mail address, and make sure you are logged in while using the Site DST. Then, all scenarios will be automatically saved to your dashboard for you to revisit in the future. You can also name each scenario for better differentiation.
All saved scenarios can be viewed in your personal dashboard, where you can view, modify, or delete them as needed.